
Table of Contents
Introduction
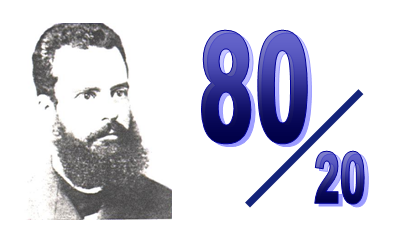
A Pareto chart is a quality management tool that applies the 80/20 principle, which states that approximately 80% of problems stem from 20% of causes. This statistical approach allows healthcare professionals to identify and focus on the most significant issues affecting patient outcomes and service quality. By visually representing data in a bar graph format, Pareto analysis enables decision-makers to prioritize corrective actions effectively.
Understanding the Pareto Chart
A Pareto chart consists of bars that represent different causes of a problem, arranged in descending order of frequency, and a cumulative percentage line that helps visualize their impact. The left vertical axis measures the frequency or number of occurrences, while the right vertical axis shows the cumulative percentage.
This chart allows healthcare administrators and professionals to focus their efforts on addressing the most critical factors rather than dispersing resources across multiple lesser issues.
The Role of Pareto Analysis in Healthcare
Pareto analysis is widely used in healthcare settings to identify the most pressing challenges and streamline processes. Its applications include:
- Enhancing Patient Safety
Medical errors and patient safety incidents are major concerns in healthcare. By analyzing error reports using a Pareto chart, hospitals can identify the primary causes of adverse events.
For example:
-80% of medication errors may be traced to 20% of the most common contributing factors, such as poor handwriting, miscommunication, or similar drug names.
-By focusing on these root causes, hospitals can implement targeted interventions such as electronic prescribing and barcode medication administration to improve patient safety.
- Reducing Hospital Readmissions
Readmissions place a financial and operational burden on healthcare institutions. A Pareto analysis of readmission data can help pinpoint the main reasons patients return to the hospital within a short period.
For instance:
-If 80% of readmissions stem from 20% of causes, such as inadequate discharge planning or medication non-adherence, targeted interventions like improved patient education and follow-up care can be implemented to reduce readmission rates.
- Improving Staff Efficiency and Workflow
Healthcare facilities often struggle with inefficiencies in workflows, leading to long wait times, staff burnout, and operational bottlenecks. A Pareto chart can help administrators identify the main inefficiencies in hospital workflows.
For example:
-If 80% of patient delays are caused by 20% of inefficiencies, such as slow lab turnaround times or delays in specialist consultations, focused process improvements can be implemented.
-Hospitals can introduce automation in test processing, implement digital communication tools, or improve triage procedures to streamline operations.
- Optimizing Resource Allocation
Hospitals and clinics operate with limited resources, making efficient allocation critical to patient care and cost-effectiveness. Pareto analysis can help healthcare managers determine where resources should be directed for maximum impact.
For example:
- If 80% of emergency department overcrowding is linked to 20% of underlying causes (e.g., non-emergency visits or delayed patient discharges), measures such as patient education campaigns and improved discharge planning can be prioritized.
- By focusing on high-impact areas, hospitals can optimize resource utilization and reduce waste.
- Boosting Patient Satisfaction
Patient satisfaction is a key performance indicator in healthcare. Using a Pareto chart to analyze patient complaints and feedback allows healthcare providers to identify the most common dissatisfaction factors.
For instance:
- If 80% of patient dissatisfaction arises from 20% of issues, such as long wait times and poor communication, efforts can be concentrated on improving appointment scheduling systems and enhancing staff communication training.
- Addressing these high-impact areas leads to a better patient experience and improved overall service quality.
Case Study: Using Pareto Analysis to Reduce Patient Wait Times
A hospital emergency department conducted a Pareto analysis on patient wait times and found that:
- 80% of delays were caused by 20% of issues, primarily a shortage of available physicians and prolonged diagnostic testing times.
Interventions were implemented, including:
- Hiring additional emergency room physicians during peak hours.
- Implementing point-of-care testing to speed up diagnostics.
After six months, the hospital reported a 30% reduction in patient wait times and a significant improvement in patient satisfaction scores.
How Healthcare Professionals Can Use Pareto Analysis for Better Patient Outcomes
- Identifying Root Causes of Problems – Instead of treating symptoms, healthcare professionals can target underlying causes for sustainable improvements.
- Making Data-Driven Decisions – Pareto analysis ensures that decision-making is backed by empirical data rather than assumptions.
- Prioritizing Interventions – Efforts and resources can be focused on the most significant factors affecting patient care.
- Tracking Improvement Over Time – Changes and their impacts can be measured, ensuring continuous improvement.
- Facilitating Communication Among Teams – A visual Pareto chart helps align healthcare teams on priority areas for action.
Conclusion
The Pareto chart is an invaluable tool in healthcare for identifying and addressing the most critical issues affecting patient care, safety, and operational efficiency. By focusing on the highest-impact areas, healthcare professionals can drive meaningful improvements in service delivery and patient outcomes. Hospitals and clinics that implement Pareto analysis as part of their quality improvement initiatives are better equipped to enhance efficiency, reduce costs, and improve overall healthcare experiences.
References
- Juran, J. M. (1992). Juran on Quality by Design. Free Press.
- Deming, W. E. (1986). Out of the Crisis. MIT Press.
- Basu, R., & Wright, J. N. (2003). Quality Beyond Six Sigma. Elsevier.
- Ishikawa, K. (1985). What is Total Quality Control? The Japanese Way. Prentice-Hall.
- Donabedian, A. (2003). An Introduction to Quality Assurance in Healthcare. Oxford University Press.
About The Author


